Dashboard Gadget
Jira Capacity Planner includes a powerful gadget that allows you to visualize the capacity planner directly on your Jira dashboards. This provides immediate visibility into team workload without needing to navigate to a specific project.
Adding the Gadget to a Dashboard
To add the gadget, follow these steps:
- Go to the Jira dashboard where you want to add the gadget.
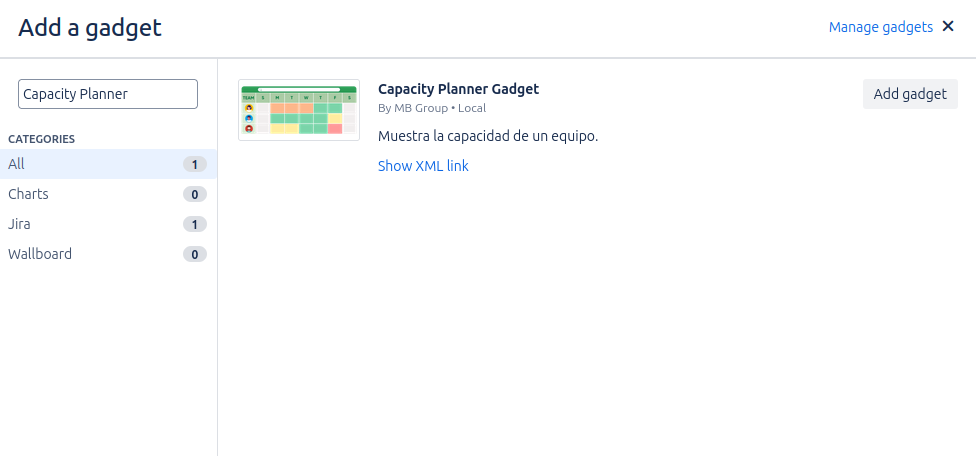
- Click the Add gadget button in the top right corner.
- Search for "Capacity Planner" in the gadget modal.
- Click Add next to the Capacity Planner Gadget.
Gadget Configuration
Once added, the gadget will require initial configuration to function. The setup is simple and allows you to define the context of the information to be displayed.
Configuration Options
In the configuration form, you can define the following:
- Default Team: This is the only configuration field. Select the team from the list whose capacity data you want to be displayed by default whenever the dashboard loads.
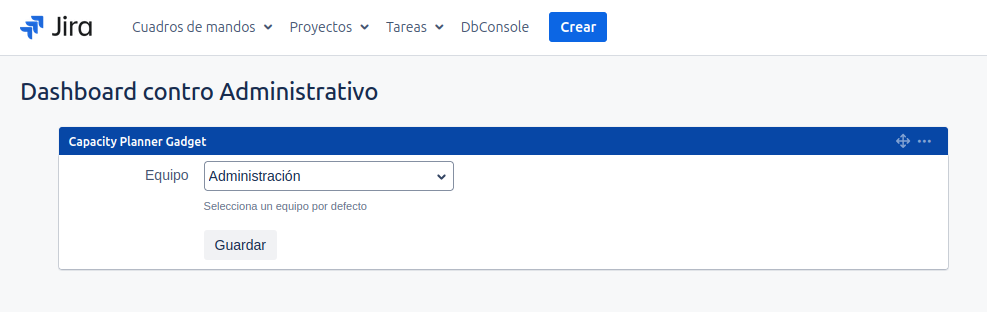
Once the team is selected, click Save.
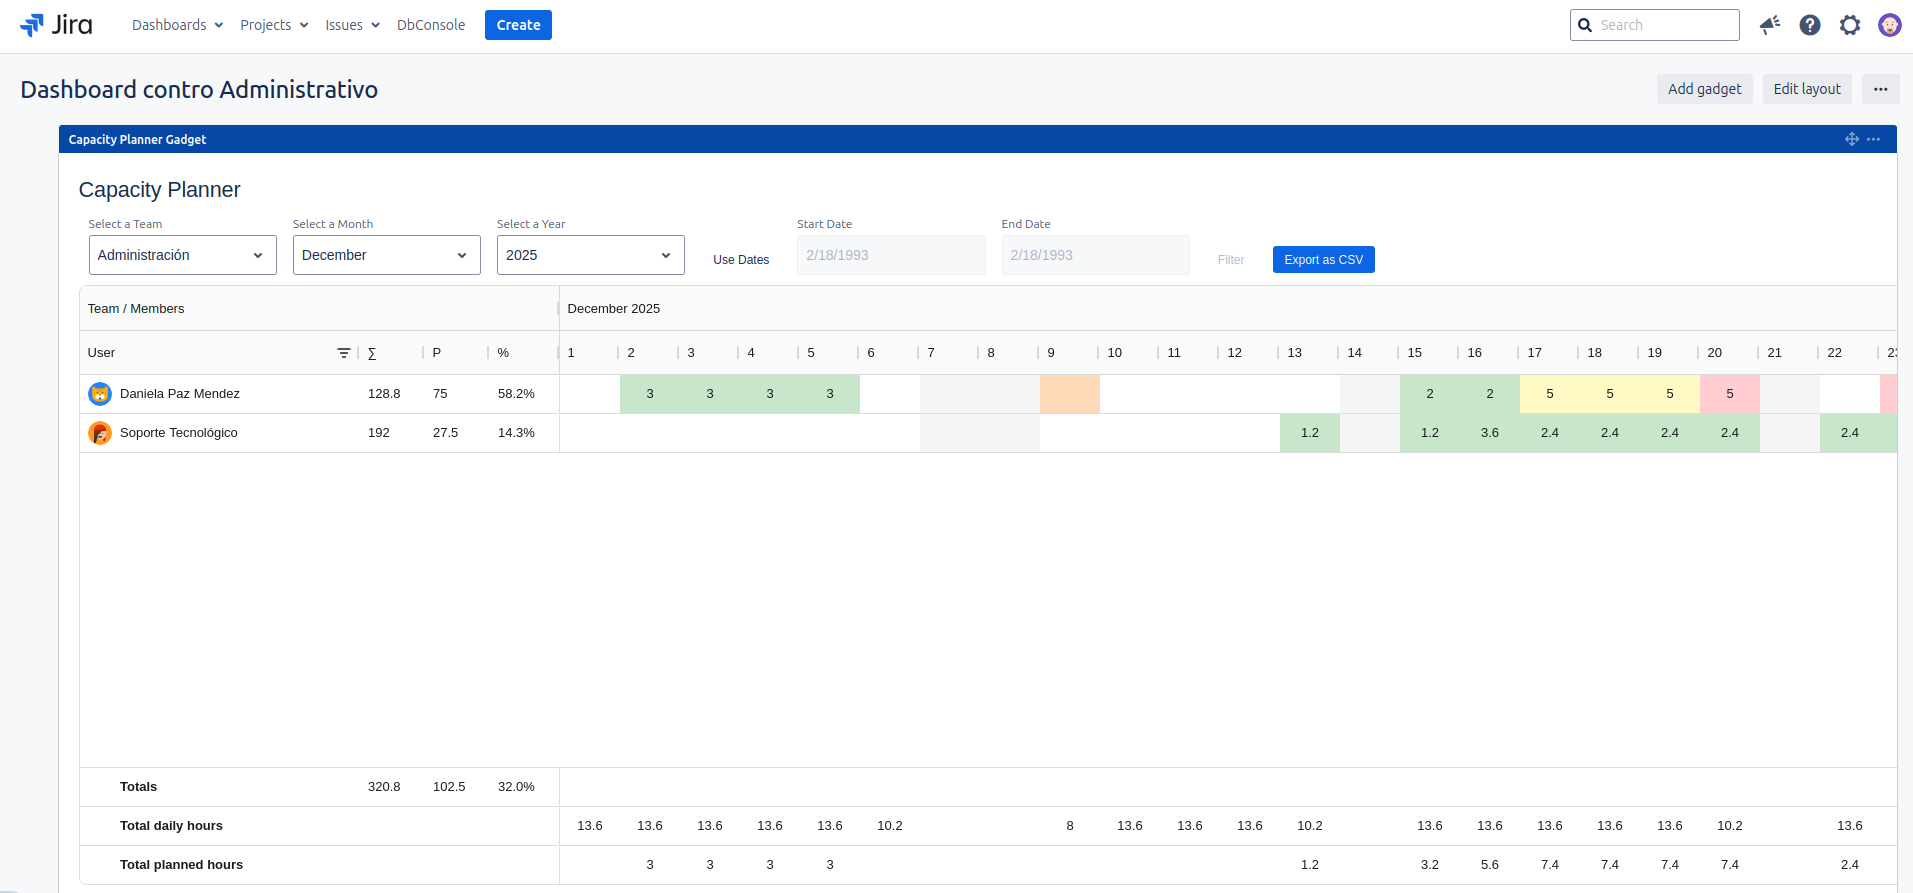
Gadget View
The gadget will display the capacity planner view for the selected team. It includes the same visual indicators for load and absences as the project view.
Interactive Controls
Although the gadget has a default team configured, it offers interactive controls for temporary analysis:
- Team Selector: Allows you to temporarily switch the view to another team.
- Date Controls: Allows you to navigate by months/years or select a custom date range.
- Export to CSV: Exports the current view to a CSV file.
Changes made with the team or date selectors within the gadget are temporary. If you reload the page or the dashboard, the gadget will revert to showing the information for the default configured team.