Using the Traffic Light field
This guide describes how to work with a Traffic Light KPI custom field that has already been configured by your administrator. If you do not yet see the field on your issue screens, check with your Jira administrator: it probably just needs to be added to the corresponding screen or to have its context thresholds defined.
Entering a value on an issue
When the Traffic Light field is part of the Create or Edit screen of an issue, it appears as a simple numeric field, ready to enter a value.
- Open the issue's create or edit form.
- Locate the Traffic Light field (the exact name is defined by the administrator, for example "Compliance level" or "Project risk").
- Enter the numeric value that corresponds to the issue (for example
45,92.5). - Save the changes.
If you enter text that is not a valid number, Jira will display an error message and will not allow saving until you correct the input.
Viewing the indicator on the issue
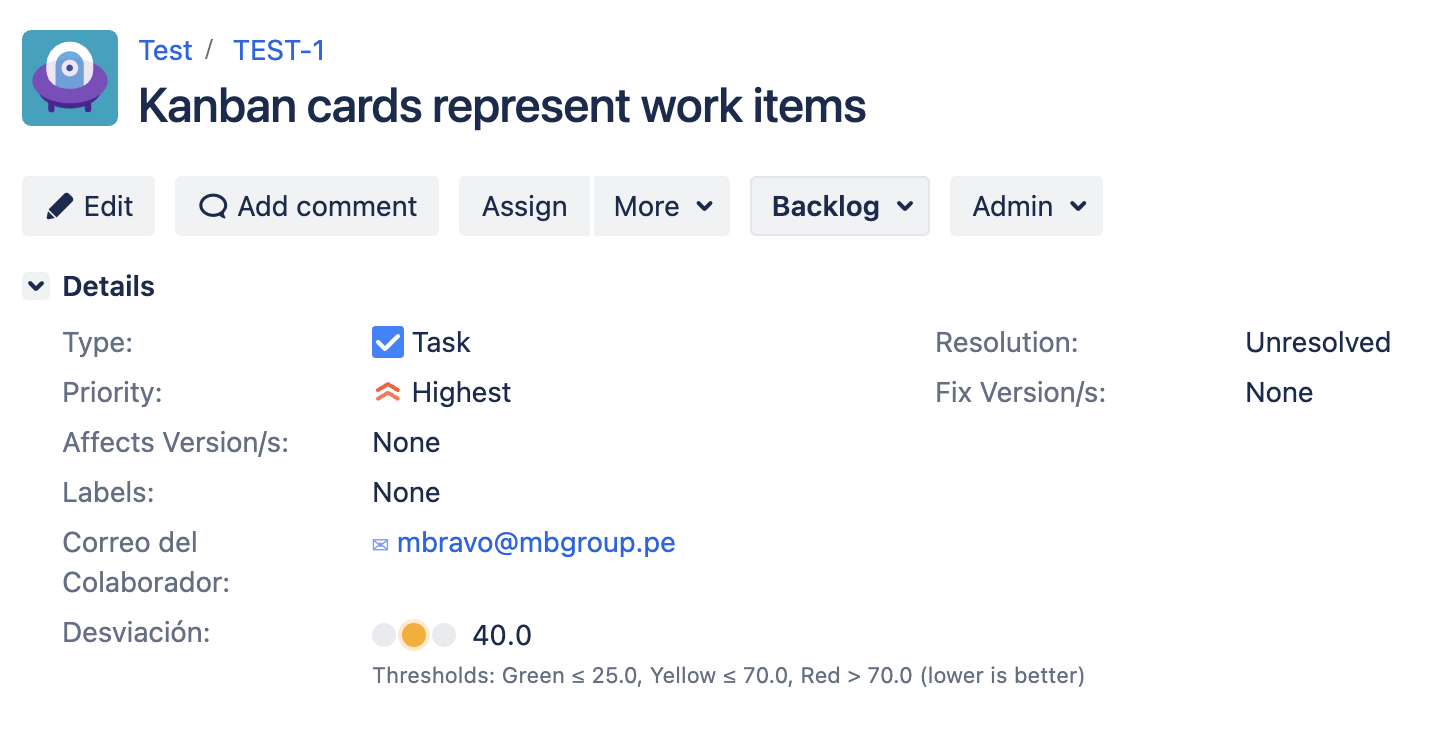
Once saved, the field is shown on the issue view as a three-bulb indicator (green, yellow and red) along with the numeric value entered. The lit bulb reflects the state:
- 🟢 Green: favorable situation according to the rules defined by your administrator.
- 🟡 Yellow: intermediate / at-risk situation.
- 🔴 Red: adverse or critical situation.
- ⚪ Gray: the field is empty or the administrator has not yet configured thresholds for that context.
The indicator also appears on issue listings (navigator view, dashboard gadgets, boards) in a compact version, which lets you read the state of several issues at a glance.
The indicator and its numeric value are readable in both Jira's light and dark themes.
Thresholds legend and tooltip
Right below the indicator you will find a legend with the ranges that define each color in the issue's context. Additionally, when you hover over the lit bulb, a tooltip appears showing the exact range the value belongs to (for example, "Red: ≤ 30" or "Green: > 70").
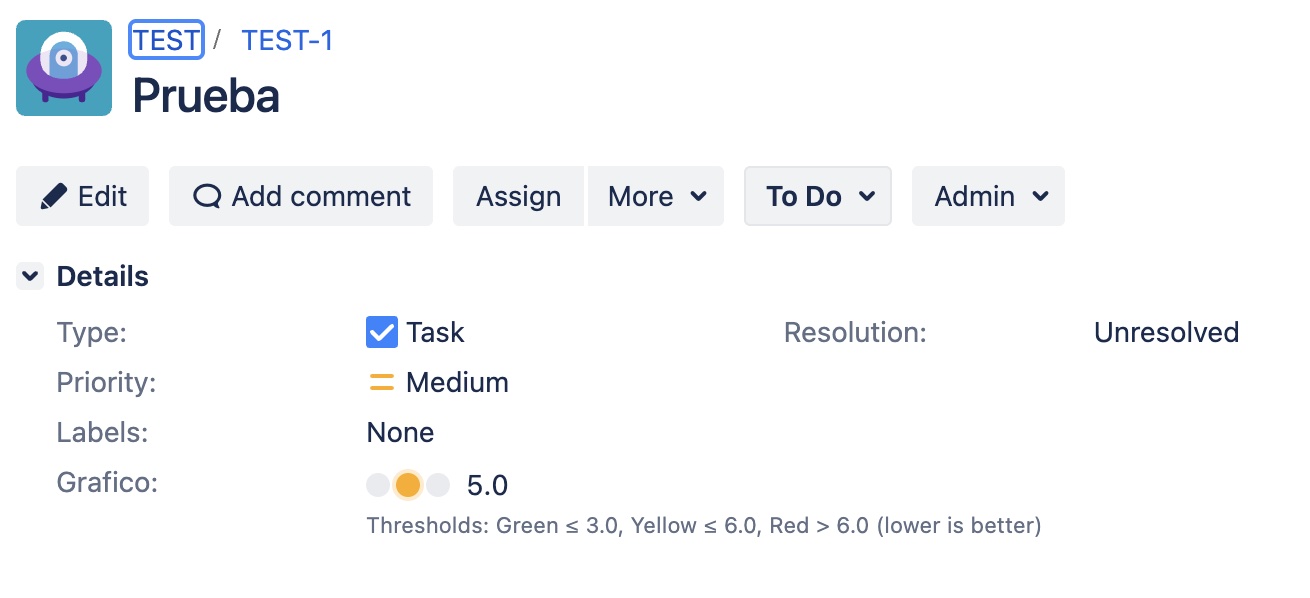
This lets you interpret the issue's state immediately, without having to remember the thresholds configured for each project.
On some KPIs a low value indicates a better result (for example, resolution time or number of incidents). Your administrator can enable the "lower is better" mode on the corresponding context: in that case, low values are shown in green and high ones in red. The legend and the tooltip always reflect the active rule, so you do not need to worry about interpreting the inversion.
Thresholds can vary between projects or between issue types: your administrator can define different rules in each context. If you have doubts about why a specific value is shown in a given color, check the legend on the indicator itself or ask your administrator which thresholds rule the context of that issue.
Editing the value from the issue view
Starting with version 1.4.0, you can update the numeric value of the Traffic Light KPI field directly from the issue detail view, without opening the full edit screen.
You must have the Edit Issues permission in the project to edit the value from the issue view. Users without that permission will see the indicator in read-only mode.
How to edit the value
- Open the issue you want to update.
- Locate the Traffic Light KPI field in the details panel.
- Hover over the field (or focus on the indicator area): a pencil icon will appear indicating the field is editable.
- Click the pencil icon to activate the edit form.
- Enter the new numeric value in the field that appears.
- Click Save to confirm the changes, or Cancel to discard them.
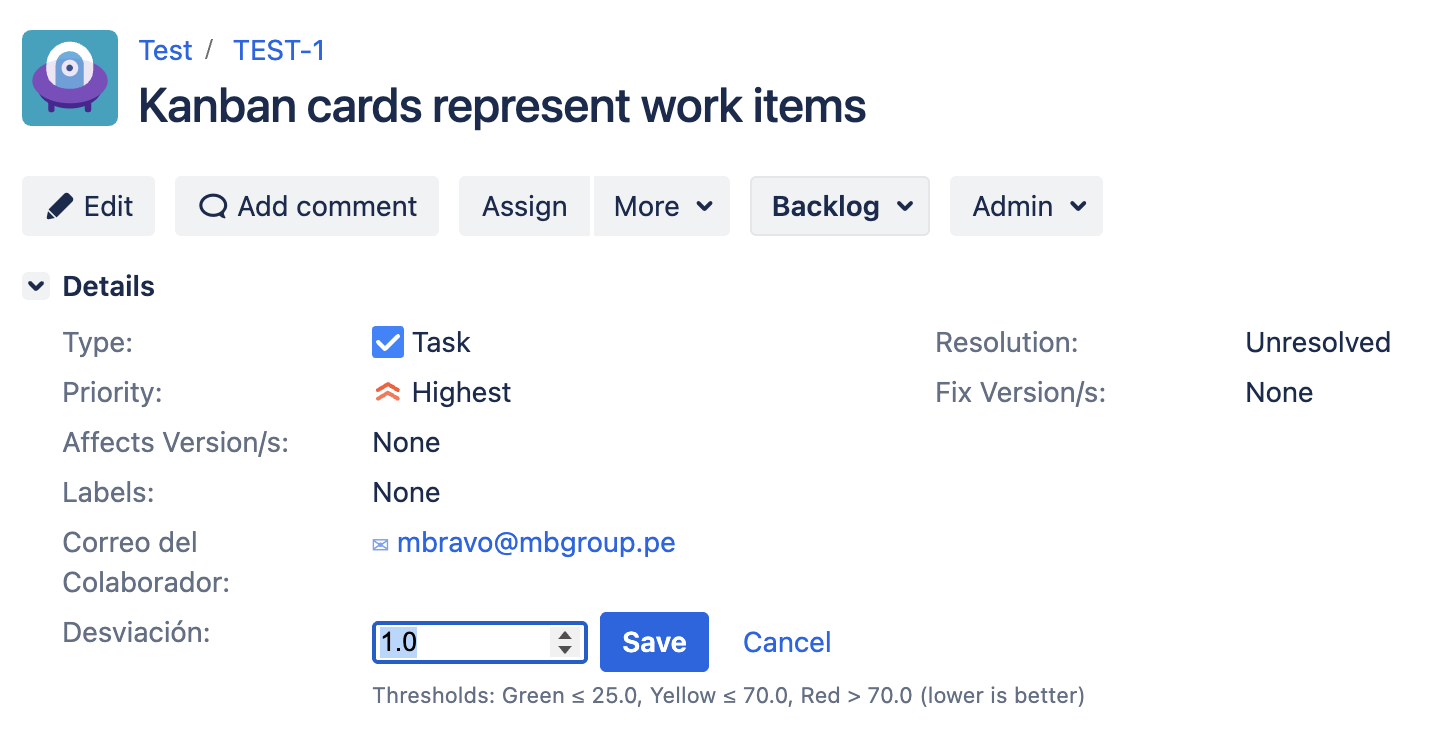
After saving, the indicator updates immediately: the numeric value and the bulb color reflect the new state according to the active context's thresholds (including the "lower is better" mode if enabled). The threshold legend remains unchanged.
If you leave the field blank and save, the indicator will turn gray (no value associated with the issue).
Limitations
Inline editing is not available on board views, dashboard gadgets, or issue navigator columns. To update the value from those contexts, open the full issue.
- It is not possible to select the color directly: the color is always calculated automatically from the entered value and the context thresholds.
- Thresholds cannot be modified from the issue view; to change them, the administrator must access the field configuration.
Searching issues by value
You can locate issues by the Traffic Light field value in two ways:
1. From the basic search
In the Issues view, open the advanced filters and locate the Traffic Light field among the available filters. You can filter by numeric range (equal to, greater than, less than, between two values).
2. From JQL
You can also use JQL for more complex queries. For example:
"Compliance level" < 30
"Compliance level" >= 70 AND project = "ACME"
"Project risk" >= 1 AND "Project risk" <= 3
Replace the field name with the one assigned by your administrator.
JQL queries do not filter by color but by the stored numeric value. To list, for example, "all red issues", combine the operator with the same red threshold that rules the context: "Compliance level" <= 30.
When to leave it blank
If the field is not marked as required in your project, you can leave it blank without producing any error. The indicator will render in gray to signal that there is no value associated with the issue.