Traffic Light KPI Custom Field
The Traffic Light KPI custom field lets you store a numeric value per work item and display it as a three-color indicator — 🔴 red, 🟡 yellow, and 🟢 green — resolved from per-context thresholds.
It's designed to represent KPIs, service levels, response times, completion percentages, risks, or other indicators where the numeric value matters but, above all, you need to communicate at a glance whether the situation is good, intermediate, or critical.
The Traffic Light KPI on Cloud ships functional parity equivalent to version 1.2.0 of the Data Center add-on: per-context thresholds, descriptive legend, rule tooltip, "Lower value is better" mode, and dark-mode support.
Create the Traffic Light KPI field
-
In Jira, click the Settings (gear) icon in the top-right corner.
-
Select Work items.
-
In the left sidebar, under Fields, click Custom fields.
-
Click Create custom field in the top-right corner.
-
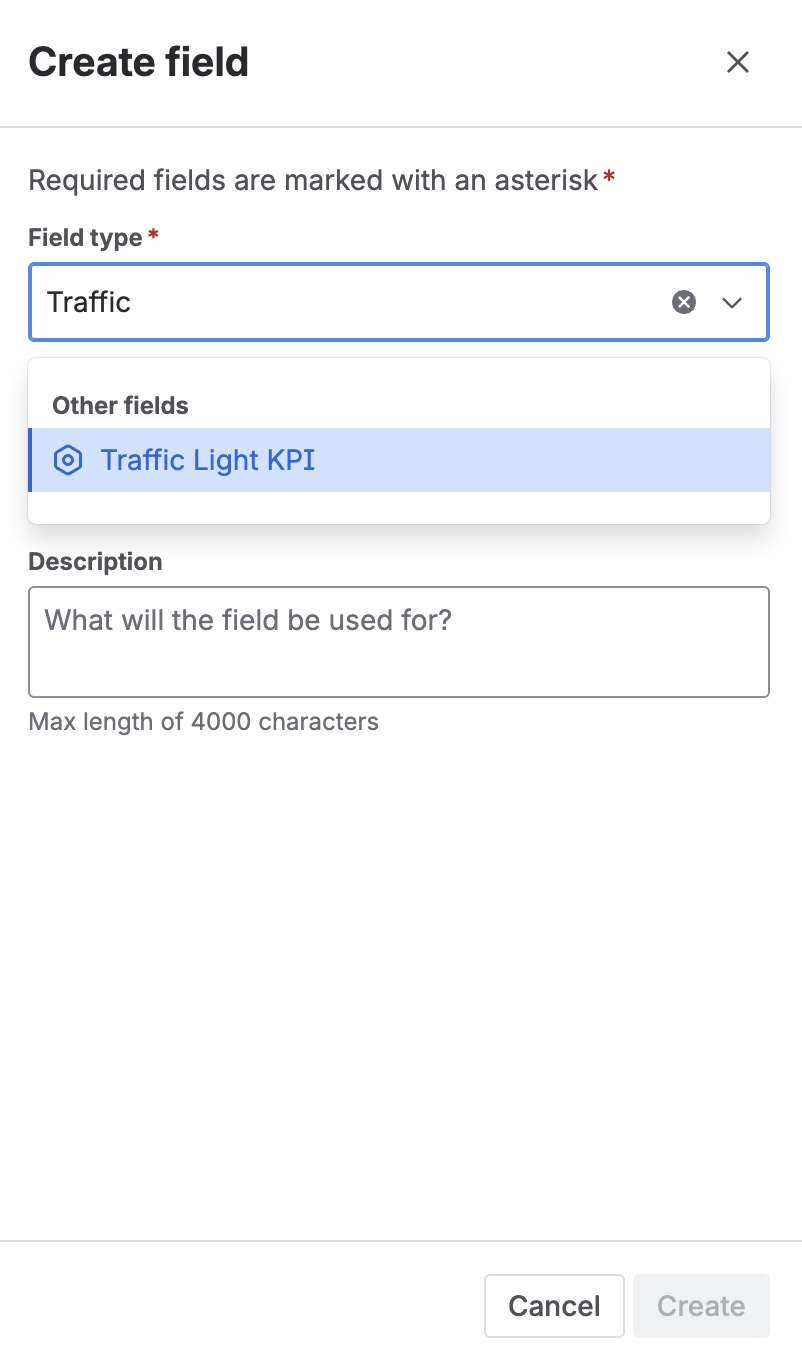
On the "Select a field type" screen, find and pick Traffic Light KPI (provided by Admin Essentials). Click Next.
💡 You'll recognize it by its description: "Numeric KPI rendered as a red/yellow/green indicator with per-context thresholds." and the traffic-light icon.
-
Name and description:
- Enter a Name (for example, "Compliance level", "Project risk", "Support SLA").
- Add an optional Description.
-
Click Create.
-
Associate to screens: Pick the relevant screens (create, edit, view, transition) and click Update.
The field is now available. However, the indicator won't show colors yet: you need to configure thresholds in each context (next section).
While a field context has no thresholds, saved numeric values render in gray (no status). This is intentional: it avoids displaying a color that could lead to misinterpretation until the administrator defines the business rule.
Configure thresholds per context
The Traffic Light KPI thresholds are always tied to the field's configuration context (FieldConfigContext). That means you can define different thresholds per space or work type, based on the contexts you create on the field.
Threshold model
Each context requires two numeric values and an interpretation mode:
- Low threshold (Red max) — Maximum value considered red. Any value less than or equal to this threshold renders a red indicator.
- High threshold (Yellow max) — Maximum value considered yellow. Values greater than
Lowand less than or equal toHighrender yellow. Values greater thanHighrender green. - Lower value is better — Optional checkbox that inverts the color assignment for KPIs where a lower value means better performance.
In the default mode (higher is better) the rule is:
| Work item value | Resulting color |
|---|---|
value ≤ Low | 🔴 Red |
Low < value ≤ High | 🟡 Yellow |
value > High | 🟢 Green |
| Empty value / context not configured | ⚪ Gray (no status) |
When Lower value is better is enabled, the assignment is inverted without changing the threshold order:
| Work item value | Resulting color |
|---|---|
value ≤ Low | 🟢 Green |
Low < value ≤ High | 🟡 Yellow |
value > High | 🔴 Red |
| Empty value / context not configured | ⚪ Gray (no status) |
Enable it for KPIs where a lower value means a better result: resolution time, open issues, critical defects, mean response time, etc. The indicator will show green for low values (desirable) and red for high values (critical) without you having to manually invert the meaning of the thresholds.
Invariant
The editor enforces Low < High. If you enter values that don't respect this relation, the form refuses to save with an error.
Steps to configure thresholds
-
Go to Settings → Work items → Custom fields.
-
Find the Traffic Light KPI field you created and click the actions menu (
⋯) → Contexts and default value. -
On the field contexts page, open the context you want to configure.
-
Inside the context you'll see a section provided by Admin Essentials called Traffic Light thresholds, with a summary of the current thresholds (or the message "No thresholds configured. Values render gray." if none are set yet).
-
Complete the form:
- Low threshold (Red max): numeric value.
- High threshold (Yellow max): numeric value strictly greater than the previous one.
- Lower value is better: tick the checkbox if your KPI runs in reverse.
-
Click Save.
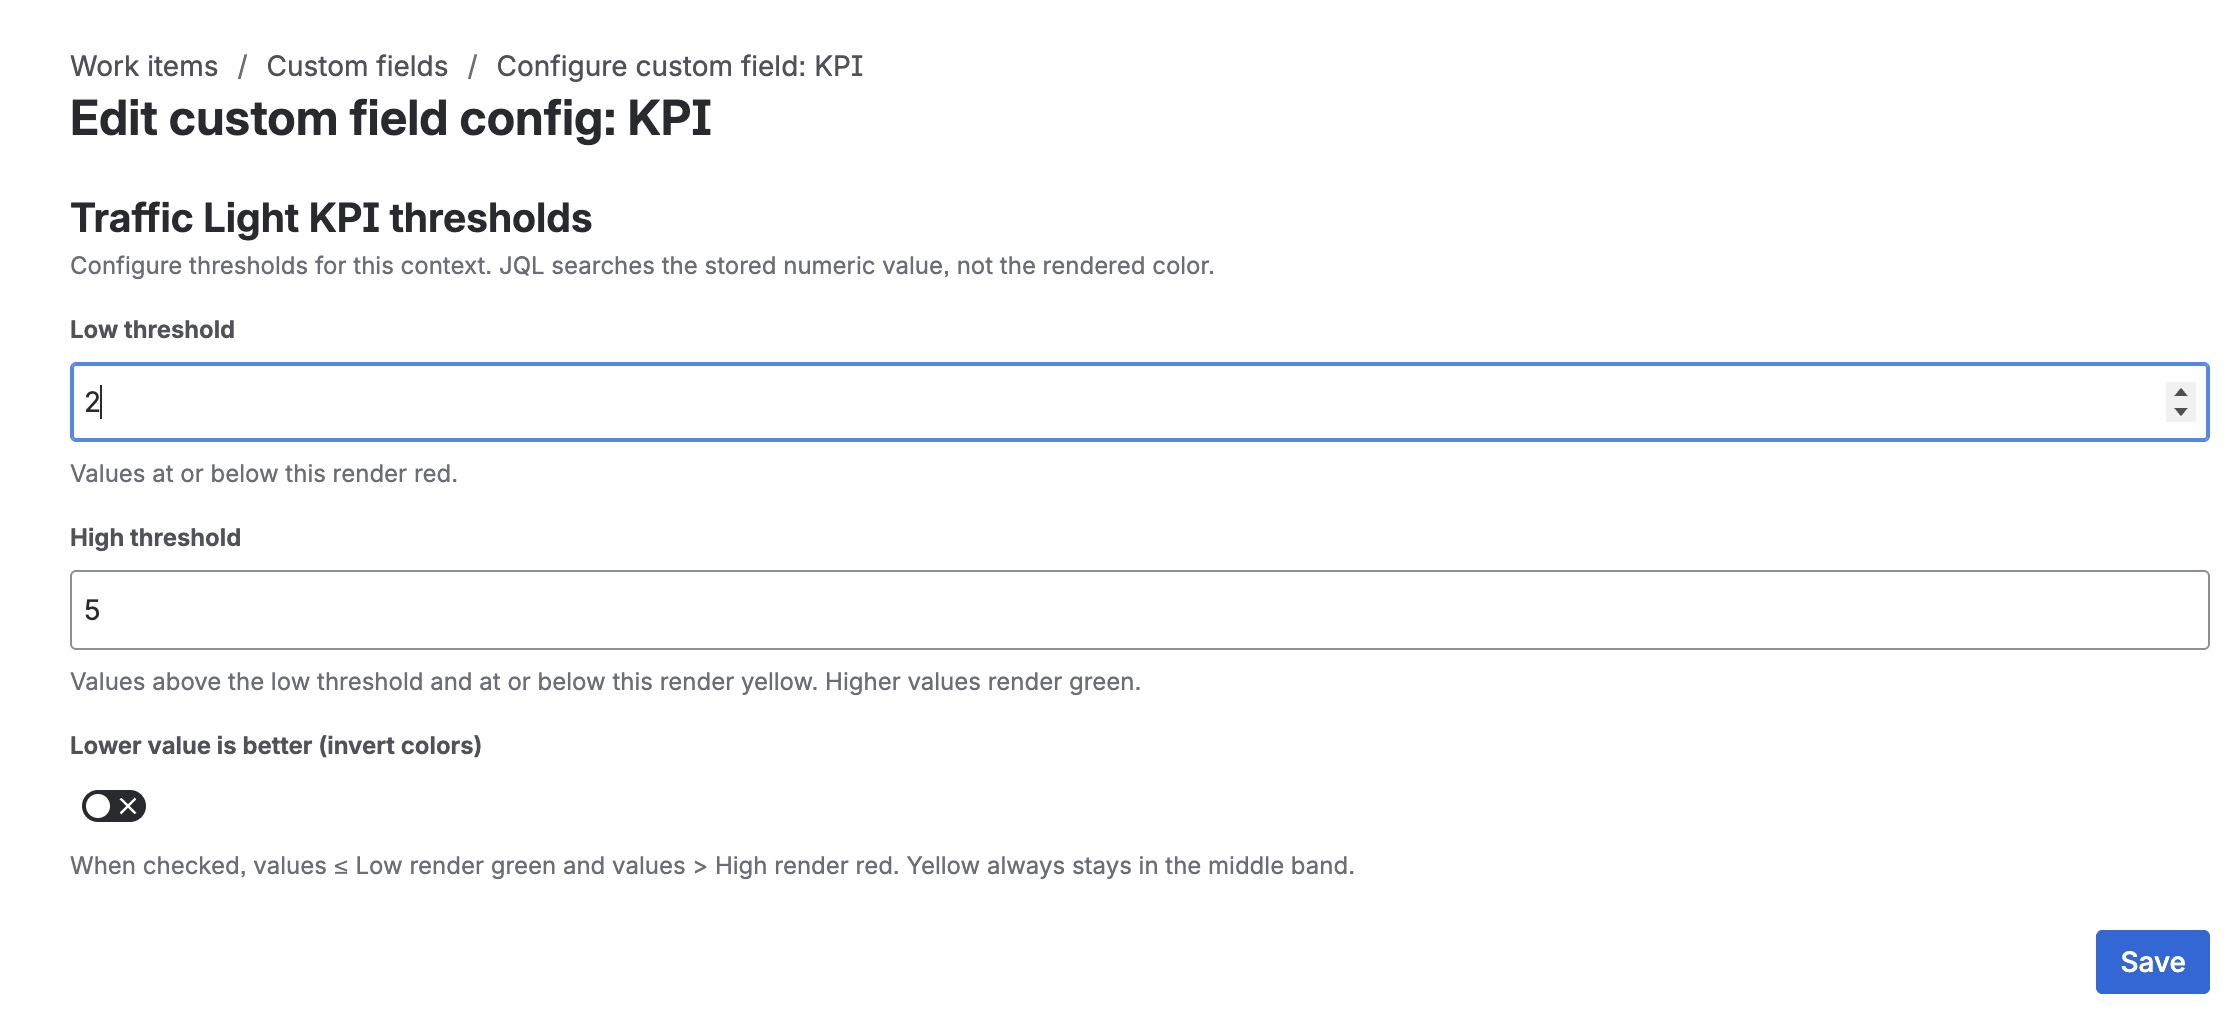
After saving, work items in that context will start rendering the indicator with the resolved colors.
Example: compliance KPI (0–100)
Imagine a field called "Compliance level" expressed as a percentage:
- Low:
30→0to30is critical (red). - High:
70→31to70is at risk (yellow). - Greater than
70→ on track (green). - Lower value is better: off.
If you reuse the same field across multiple spaces with different tolerances, simply create a context per space and define independent thresholds in each.
Example: average resolution time ("lower is better" mode)
For a Traffic Light field called "Resolution time (hours)" where a low value is desirable:
- Low:
4→0to4hours is excellent (green). - High:
12→5to12hours is acceptable (yellow). - Greater than
12→ slow response (red). - Lower value is better: on.
Note that the thresholds keep the order Low < High; the meaning change comes from the Lower value is better option.
Possible validation errors
The editor validates input and shows specific messages when:
- One of the fields is empty → "This field is required."
- The entered value is not a valid number → "Please enter a valid number."
Lowis greater than or equal toHigh→ "Low threshold must be strictly less than the high threshold."
Rendering on the work item view
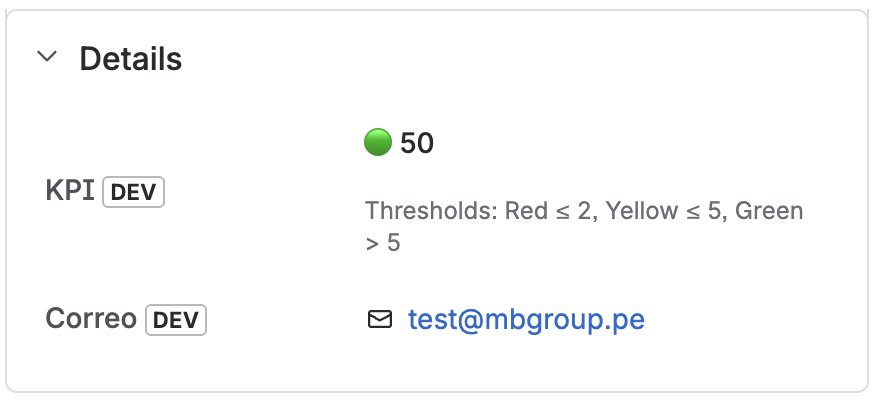
When a work item has a numeric value and its context has thresholds defined, the add-on renders a colored indicator along with the numeric value. The color reflects the resolved status and an accessible aria-label describes it for screen readers.
Descriptive legend
Below the indicator appears a legend describing the ranges configured for the context. It adapts automatically to the active mode:
- In the default mode, ascending ranges are shown (
≤ Low → red,Low < … ≤ High → yellow,> High → green). - In Lower value is better mode, the ranges stay the same but the color assignment reflects the inversion.
Hover tooltip
Hovering over the colored indicator shows a tooltip with the exact range to which the current work item value belongs (for example, "Red: ≤ 30" or "Green: > 70"). This lets you interpret the state at a glance without having to open the field configuration.
The legend, tooltip, and numeric value are built with UI Kit 2 design tokens (color.text, color.text.subtlest), so they render with accessible colors in both light and dark themes of Jira Cloud, preserving contrast in either mode.
Search and JQL support
The field is registered in Forge with type: number, which enables JQL's standard numeric operators:
| Operator | Supported | Example |
|---|---|---|
= / != | ✅ | "Compliance level" = 100 |
< / <= / > / >= | ✅ | "Compliance level" >= 70 |
is EMPTY / is not EMPTY | ✅ | "Compliance level" is not EMPTY |
in / not in | ✅ | "Compliance level" in (50, 75, 100) |
These operators compare the stored numeric value.
Search by colour
From version 1.9.0, the trafficLightBand JQL function searches by the colour the indicator shows, applying the thresholds of each work item's context. You don't need to repeat the thresholds in the query:
issue in trafficLightBand("red")
issue in trafficLightBand("yellow", "customfield_10042")
issue not in trafficLightBand("green")
- Bands:
"red","yellow", or"green". Operators:inandnot in. - The second argument (optional) narrows the search to one field, by ID or by name. Without it, the search covers every Traffic Light KPI field on the site.
- The query works as a saved filter, as the source of a dashboard gadget, or as a JSM queue.
- A value change shows up once Jira indexes the work item (usually a few seconds). An empty field, or a context without thresholds (gray), matches no band.
- No backfill needed: the function reads the field value, so it also includes work items that haven't been saved again since the upgrade.
See the full reference (argument variants, threshold changes, limits, and errors) in JQL search by colour band.
Colour band in work item properties
From version 5.0.0, the add-on automatically syncs the field's colour band (🔴 red, 🟡 yellow, or 🟢 green) as an work item property, allowing workflow validators, Jira Automation rules, and external integrations to query the current colour without knowing the numeric thresholds.
See the Colour Band Properties guide for property keys, Jira Automation and REST usage examples, and their limitations (the property is not created retroactively). To search by colour, use the trafficLightBand JQL function described above.